2.7. Testing Your Configuration Changes
We saw previously how to make a series of changes to a "shadow" copy of the configuration. Before loading the changes back into the cluster (eg. crm_shadow --commit mytest --force), it is often advisable to simulate the effect of the changes with ptest. Eg.
ptest --live-check -VVVVV --save-graph tmp.graph --save-dotfile tmp.dot
The tool uses the same library as the live cluster to show what it would have done given the supplied input. It's output, in addition to a significant amount of logging, is stored in two files tmp.graph and tmp.dot, both are representations of the same thing -- the cluster's response to your changes. In the graph file is stored the complete transition, containing a list of all the actions, their parameters and their pre-requisites. Because the transition graph is not terribly easy to read, the tool also generates a Graphviz dot-file representing the same information.
Interpreting the Graphviz output
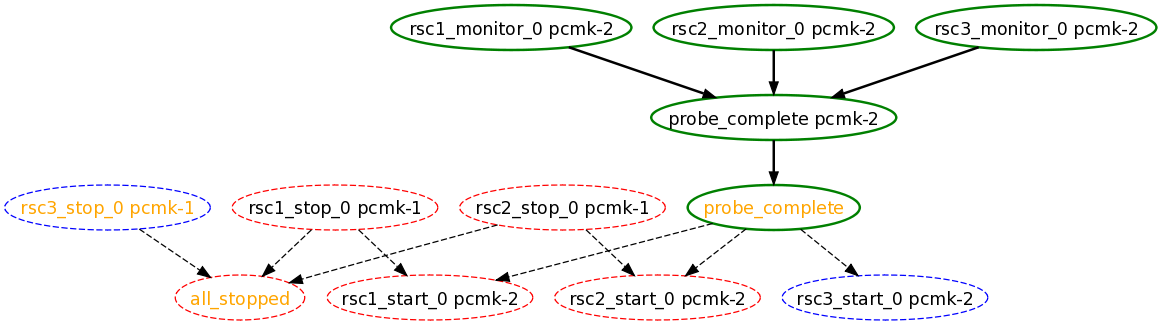
Arrows indicate ordering dependencies
Dashed-arrows indicate dependencies that are not present in the transition graph
Actions with a dashed border of any color do not form part of the transition graph
Actions with a green border form part of the transition graph
Actions with a red border are ones the cluster would like to execute but are unrunnable
Actions with a blue border are ones the cluster does not feel need to be executed
Actions with orange text are pseudo/pretend actions that the cluster uses to simplify the graph
Actions with black text are sent to the LRM
Resource actions have text of the form rsc_action_interval node
Any action depending on an action with a red border will not be able to execute.
Loops are really bad. Please report them to the development team.
In the above example, it appears that a new node, node2, has come online and that the cluster is checking to make sure rsc1, rsc2 and rsc3 are not already running there (Indicated by the *_monitor_0 entries). Once it did that, and assuming the resources were not active there, it would have liked to stop rsc1 and rsc2 on node1 and move them to node2. However, there appears to be some problem and the cluster cannot or is not permitted to perform the stop actions which implies it also cannot perform the start actions. For some reason the cluster does not want to start rsc3 anywhere.
For information on the options supported by ptest, use ptest --help